 Open Data Science Europe Metadata Catalog
1 km
Type of resources
Available actions
Topics
Keywords
Contact for the resource
Provided by
Formats
Representation types
Update frequencies
status
Resolution
-
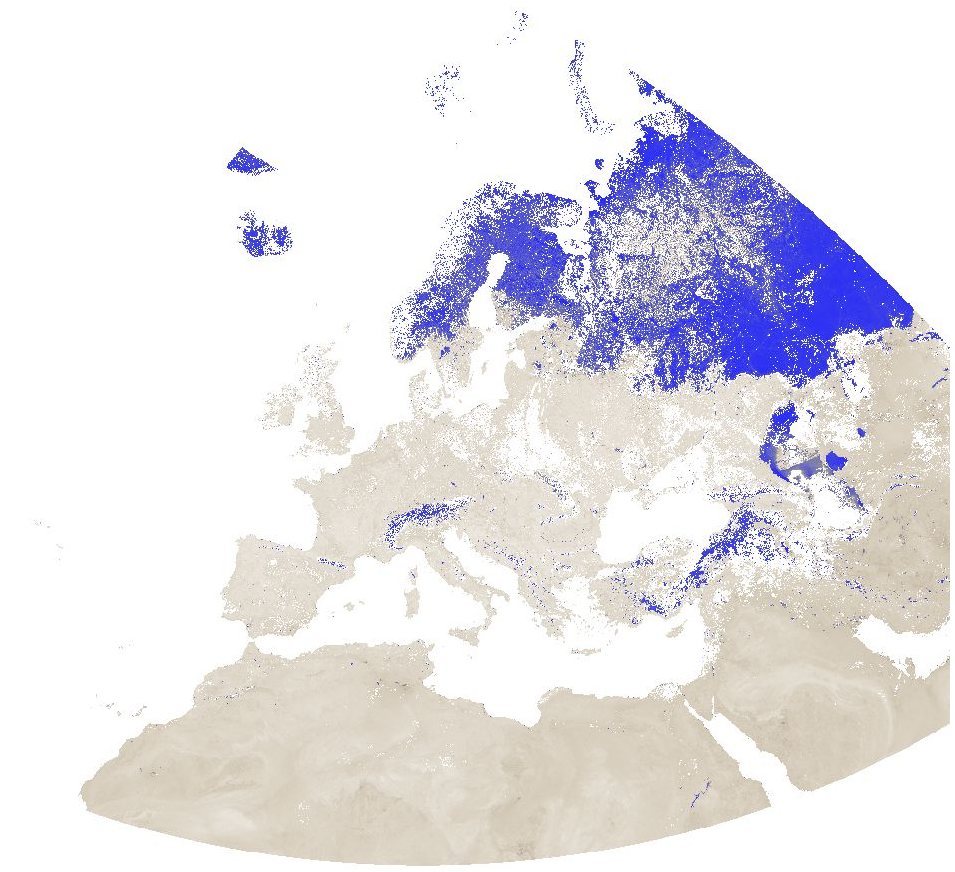
Modified Normalized Difference Water Index (MNDWI) from MODIS data for Europe at 1 km resolution. Source data: - MODIS/Terra Surface Reflectance 8-Day L3 Global 500 m SIN Grid (MOD09A1 v006): https://lpdaac.usgs.gov/products/mod09a1v006/ The corresponding MODIS/Aqua product (MYD09A1 v006) could not be used due to the fact that the Aqua satellite has a number of broken detectors resulting in unreliable data for band 6 (SWIR) measurements. The Moderate Resolution Imaging Spectroradiometer (MODIS) Terra MOD09A1 Version 6 product provides an estimate of the surface spectral reflectance of Terra MODIS Bands 1 through 7 corrected for atmospheric conditions such as gasses, aerosols, and Rayleigh scattering. Along with the seven 500 meter (m) reflectance bands are two quality layers and four observation bands. For each pixel, a value is selected from all the acquisitions within the 8-day composite period. The criteria for the pixel choice include cloud and solar zenith. When several acquisitions meet the criteria the pixel with the minimum channel 3 (blue) value is used. For the time periods October 2016 - March 2017 and August 2020 - April 2021, the original data has been reprojected to ETRS89-extended / LAEA Europe and aggregated to a 1 km grid. The temporal resolution is 8 days. Bad quality pixels (cloud, cloud shadow, dead detector, solar zenith angle too large, etc.) have been masked using the provided quality assurance (QA) layers and appear as "no data". File naming: productCode.acquisitionDate[A (YYYYDDD)]_mosaic_spatialResolution_frequency_VI.tif example: MOD09A1.A2016353_mosaic_1000m_8_days_MNDWI.tif The date is Year and Day of Year. Values are MNDWI * 10000. Example: Value -5099 = -0.5099
-
Overview: ERA5-Land is a reanalysis dataset providing a consistent view of the evolution of land variables over several decades at an enhanced resolution compared to ERA5. ERA5-Land has been produced by replaying the land component of the ECMWF ERA5 climate reanalysis. Reanalysis combines model data with observations from across the world into a globally complete and consistent dataset using the laws of physics. Reanalysis produces data that goes several decades back in time, providing an accurate description of the climate of the past. Total precipitation: Accumulated liquid and frozen water, including rain and snow, that falls to the Earth's surface. It is the sum of large-scale precipitation (that precipitation which is generated by large-scale weather patterns, such as troughs and cold fronts) and convective precipitation (generated by convection which occurs when air at lower levels in the atmosphere is warmer and less dense than the air above, so it rises). Precipitation variables do not include fog, dew or the precipitation that evaporates in the atmosphere before it lands at the surface of the Earth. This variable is accumulated from the beginning of the forecast time to the end of the forecast step. The units of precipitation are depth in metres. It is the depth the water would have if it were spread evenly over the grid box. Care should be taken when comparing model variables with observations, because observations are often local to a particular point in space and time, rather than representing averages over a model grid box and model time step. The original ERA5-Land dataset (period: 2000 - 2020) has been reprocessed to: - aggregate ERA5-Land hourly data to daily data (minimum, mean, maximum) - while increasing the resolution from the native ERA5-Land resolution of 0.1 degree (~ 9 km) to 30 arc-sec (~ 1 km) by image fusion with CHELSA data (V1.2) (https://chelsa-climate.org/). For each day we used the corresponding monthly long-term average of CHELSA. The aim was to use the fine spatial detail of CHELSA and at the same time preserve the general regional pattern and fine temporal detail of ERA5-Land. The steps included aggregation and enhancement, specifically: 1. spatially aggregate CHELSA to the resolution of ERA5-Land 2. calculate proportion of ERA5-Land / aggregated CHELSA 3. interpolate proportion with a Gaussian filter to 30 arc seconds 4. multiply the interpolated proportions with CHELSA Using proportions ensures that areas without precipitation remain areas without precipitation. Only if there was actual precipitation in a given area, precipitation was redistributed according to the spatial detail of CHELSA. Data available is the daily sum of precipitation. Software used: GDAL 3.2.2 and GRASS GIS 8.0.0 (r.resamp.stats -w; r.relief) Original ERA5-Land dataset license: https://cds.climate.copernicus.eu/api/v2/terms/static/licence-to-use-copernicus-products.pdf CHELSA climatologies (V1.2): Data used: Karger D.N., Conrad, O., Böhner, J., Kawohl, T., Kreft, H., Soria-Auza, R.W., Zimmermann, N.E, Linder, H.P., Kessler, M. (2018): Data from: Climatologies at high resolution for the earth's land surface areas. Dryad digital repository. http://dx.doi.org/doi:10.5061/dryad.kd1d4 Original peer-reviewed publication: Karger, D.N., Conrad, O., Böhner, J., Kawohl, T., Kreft, H., Soria-Auza, R.W., Zimmermann, N.E., Linder, P., Kessler, M. (2017): Climatologies at high resolution for the Earth land surface areas. Scientific Data. 4 170122. https://doi.org/10.1038/sdata.2017.122
-
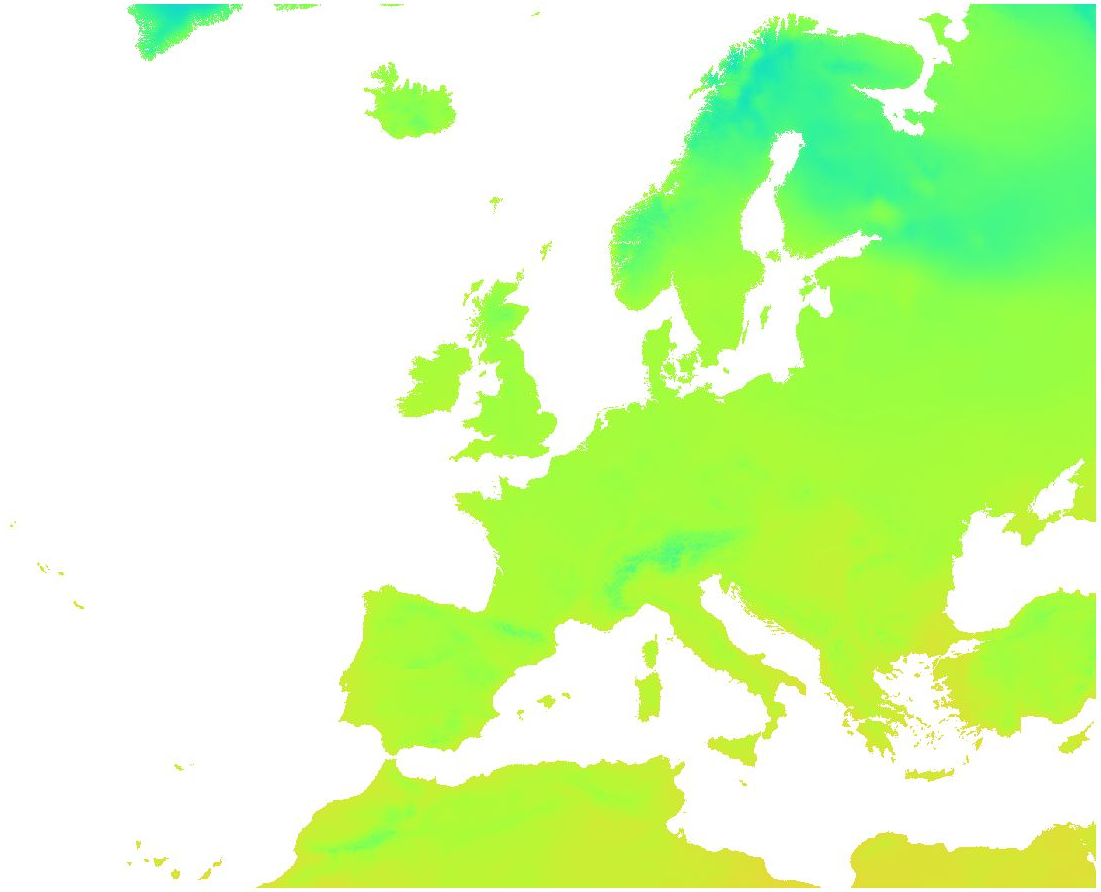
Overview: ERA5-Land is a reanalysis dataset providing a consistent view of the evolution of land variables over several decades at an enhanced resolution compared to ERA5. ERA5-Land has been produced by replaying the land component of the ECMWF ERA5 climate reanalysis. Reanalysis combines model data with observations from across the world into a globally complete and consistent dataset using the laws of physics. Reanalysis produces data that goes several decades back in time, providing an accurate description of the climate of the past. Surface temperature: Temperature of the surface of the Earth. The skin temperature is the theoretical temperature that is required to satisfy the surface energy balance. It represents the temperature of the uppermost surface layer, which has no heat capacity and so can respond instantaneously to changes in surface fluxes. The spatially enhanced daily ERA5-Land data has been aggregated on a weekly basis (starting from Saturday) for the time period 2016 - 2020. Data available is the weekly average of daily averages, the weekly minimum of daily minima and the weekly maximum of daily maxima of surface temperature. File naming: Average of daily average: era5_land_ts_avg_weekly_YYYY_MM_DD.tif Max of daily max: era5_land_ts_max_weekly_YYYY_MM_DD.tif Min of daily min: era5_land_ts_min_weekly_YYYY_MM_DD.tif The date in the file name determines the start day of the week (Saturday). Values are °C * 10. Example: Value 302 = 30.2 °C The QML or SLD style files can be used for visualization of the temperature layers.
-
Overview: ERA5-Land is a reanalysis dataset providing a consistent view of the evolution of land variables over several decades at an enhanced resolution compared to ERA5. ERA5-Land has been produced by replaying the land component of the ECMWF ERA5 climate reanalysis. Reanalysis combines model data with observations from across the world into a globally complete and consistent dataset using the laws of physics. Reanalysis produces data that goes several decades back in time, providing an accurate description of the climate of the past. Surface temperature: Temperature of the surface of the Earth. The skin temperature is the theoretical temperature that is required to satisfy the surface energy balance. It represents the temperature of the uppermost surface layer, which has no heat capacity and so can respond instantaneously to changes in surface fluxes. The original ERA5-Land dataset (period: 2000 - 2020) has been reprocessed to: - aggregate ERA5-Land hourly data to daily data (minimum, mean, maximum) - while increasing the spatial resolution from the native ERA5-Land resolution of 0.1 degree (~ 9 km) to 30 arc-sec (~ 1 km) by image fusion with CHELSA data (V1.2) (https://chelsa-climate.org/). For each day we used the corresponding monthly long-term average of CHELSA. The aim was to use the fine spatial detail of CHELSA and at the same time preserve the general regional pattern and fine temporal detail of ERA5-Land. The steps included aggregation and enhancement, specifically: 1. spatially aggregate CHELSA to the resolution of ERA5-Land 2. calculate difference of ERA5-Land - aggregated CHELSA 3. interpolate differences with a Gaussian filter to 30 arc seconds 4. add the interpolated differences to CHELSA Data available is the daily average, minimum and maximum of surface temperature. Software used: GDAL 3.2.2 and GRASS GIS 8.0.0 (r.resamp.stats -w; r.relief) Original ERA5-Land dataset license: https://cds.climate.copernicus.eu/api/v2/terms/static/licence-to-use-copernicus-products.pdf CHELSA climatologies (V1.2): Data used: Karger D.N., Conrad, O., Böhner, J., Kawohl, T., Kreft, H., Soria-Auza, R.W., Zimmermann, N.E, Linder, H.P., Kessler, M. (2018): Data from: Climatologies at high resolution for the earth's land surface areas. Dryad digital repository. http://dx.doi.org/doi:10.5061/dryad.kd1d4 Original peer-reviewed publication: Karger, D.N., Conrad, O., Böhner, J., Kawohl, T., Kreft, H., Soria-Auza, R.W., Zimmermann, N.E., Linder, P., Kessler, M. (2017): Climatologies at high resolution for the Earth land surface areas. Scientific Data. 4 170122. https://doi.org/10.1038/sdata.2017.122
-
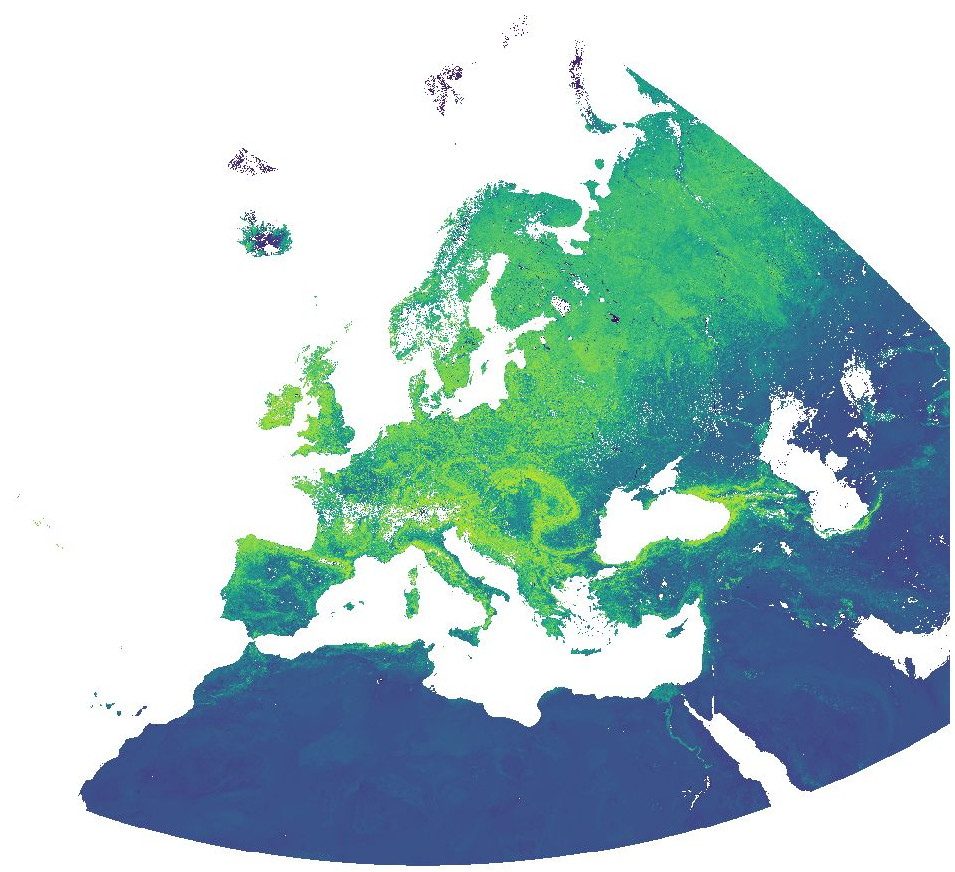
Normalized Difference Vegetation Index (NDVI) and Enhanced Vegetation Index (EVI) from MODIS data for Europe at 1 km resolution. Source data: - MODIS/Terra Vegetation Indices 16-Day L3 Global 500 m SIN Grid (MOD13A1 v006): https://lpdaac.usgs.gov/products/mod13a1v006/ - MODIS/Aqua Vegetation Indices 16-Day L3 Global 500 m SIN Grid (MYD13A1 v006): https://lpdaac.usgs.gov/products/myd13a1v006/ The MOD/MYD13A1 Version 6 product provide Vegetation Index (VI) values at a per pixel basis at 500 meter (m) spatial resolution. There are two primary vegetation layers. The first is the Normalized Difference Vegetation Index (NDVI), which is referred to as the continuity index to the existing National Oceanic and Atmospheric Administration-Advanced Very High Resolution Radiometer (NOAA-AVHRR) derived NDVI. The second vegetation layer is the Enhanced Vegetation Index (EVI), which has improved sensitivity over high biomass regions. The algorithm for this product chooses the best available pixel value from all the acquisitions from the 16 day period. The criteria used is low clouds, low view angle, and the highest NDVI/EVI value. For the time periods October 2016 - March 2017 and August 2020 - April 2021, the original data has been reprojected to ETRS89-extended / LAEA Europe and aggregated to a 1 km grid. The temporal resolution is 16 days. Bad quality pixels or pixels with snow/ice and/or cloud cover have been masked using the provided quality assurance (QA) layers and appear as "no data". File naming: productCode.acquisitionDate[A (YYYYDDD)]_mosaic_spatialResolution_frequency_VI.tif example: MOD13A1.A2020305_mosaic_1000m_16_days_NDVI.tif The date is Year and Day of Year. Values are NDVI/EVI * 10000. Example: Value 6473 = 0.6473
-
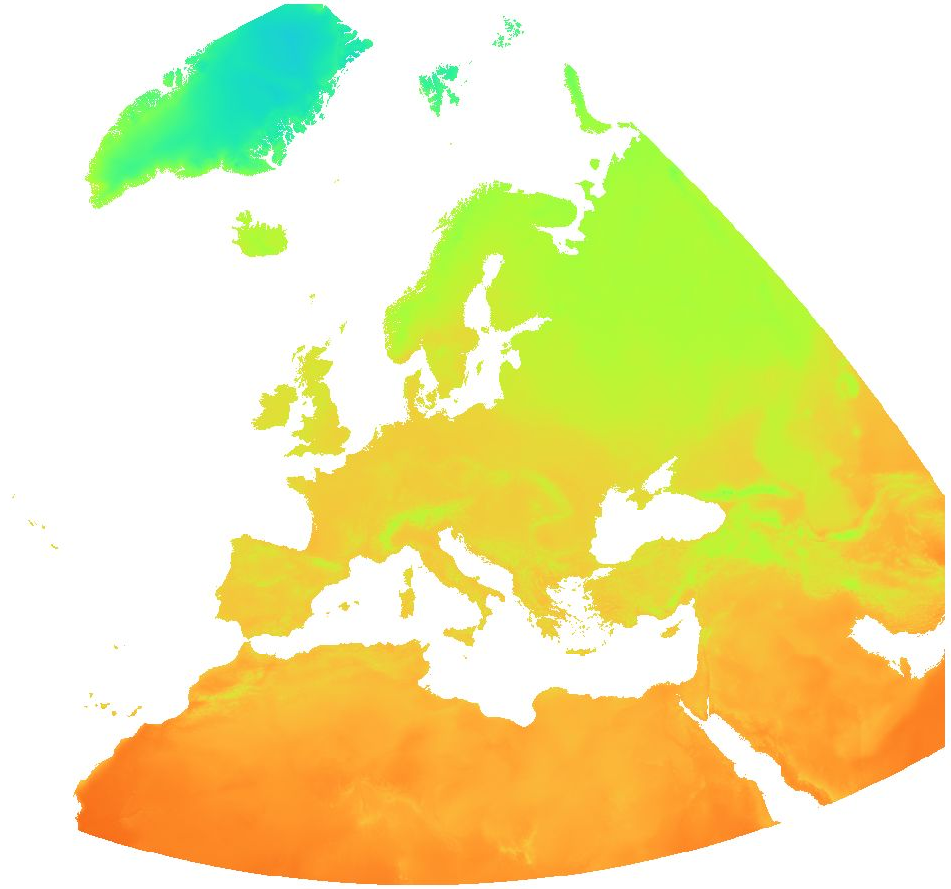
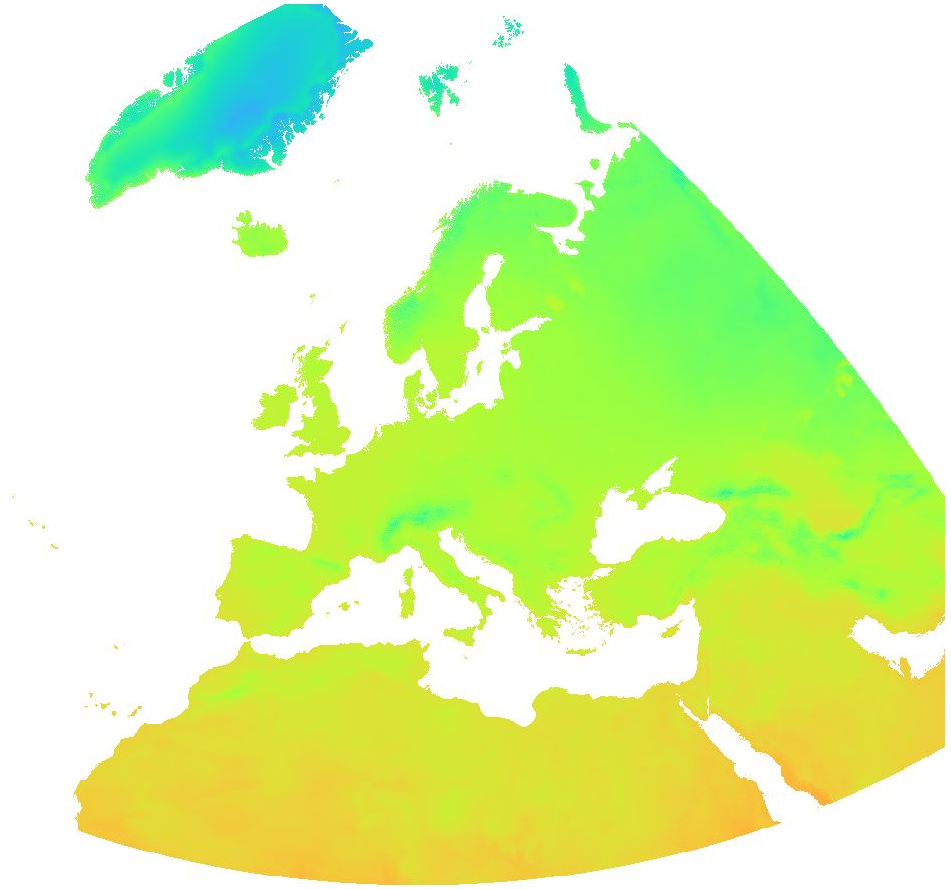
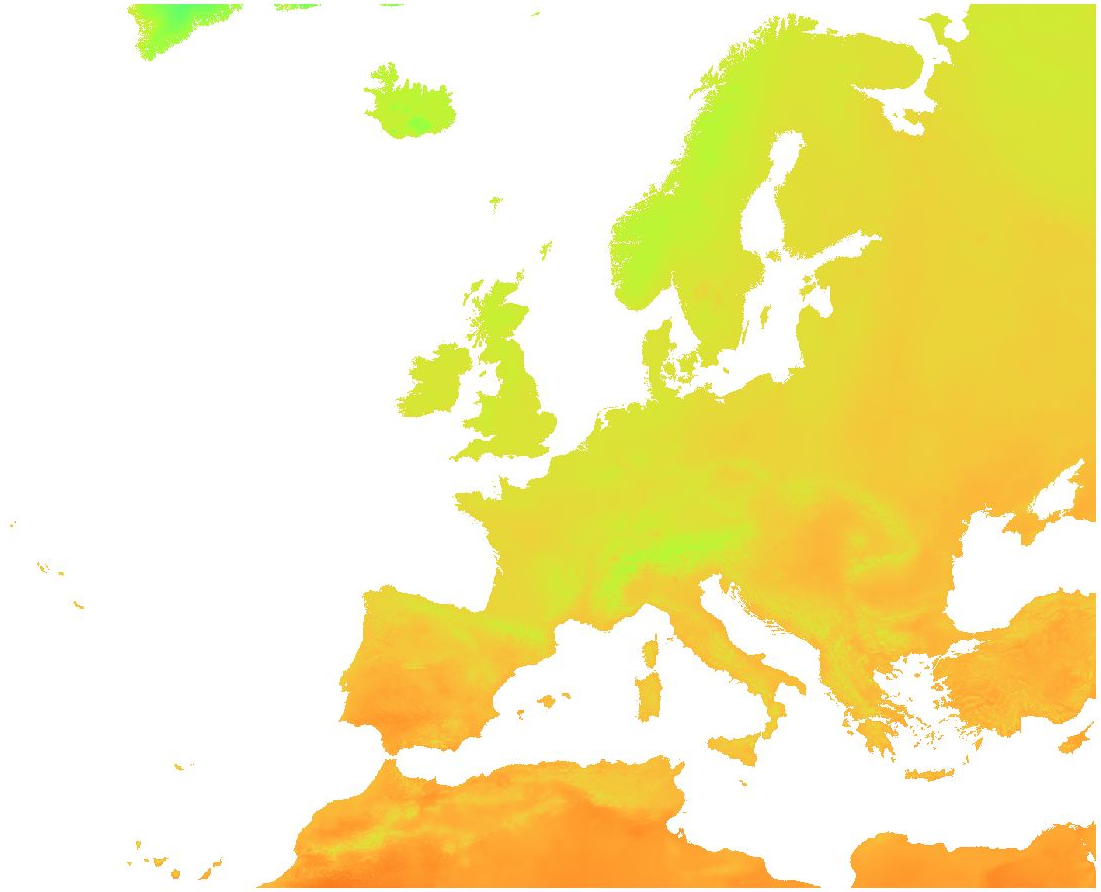
Overview: ERA5-Land is a reanalysis dataset providing a consistent view of the evolution of land variables over several decades at an enhanced resolution compared to ERA5. ERA5-Land has been produced by replaying the land component of the ECMWF ERA5 climate reanalysis. Reanalysis combines model data with observations from across the world into a globally complete and consistent dataset using the laws of physics. Reanalysis produces data that goes several decades back in time, providing an accurate description of the climate of the past. Air temperature (2 m): Temperature of air at 2m above the surface of land, sea or in-land waters. 2m temperature is calculated by interpolating between the lowest model level and the Earth's surface, taking account of the atmospheric conditions. The spatially enhanced daily ERA5-Land data has been aggregated on a weekly basis starting from Saturday for the time period 2016 - 2020. Data available is the weekly average of daily averages, the weekly minimum of daily minima and the weekly maximum of daily maxima of air temperature (2 m). File naming: Average of daily average: era5_land_t2m_avg_weekly_YYYY_MM_DD.tif Max of daily max: era5_land_t2m_max_weekly_YYYY_MM_DD.tif Min of daily min: era5_land_t2m_min_weekly_YYYY_MM_DD.tif The date in the file name determines the start day of the week (Saturday). Values are °C * 10. Example: Value 44 = 4.4 °C The QML or SLD style files can be used for visualization of the temperature layers.
-
Overview: ERA5-Land is a reanalysis dataset providing a consistent view of the evolution of land variables over several decades at an enhanced resolution compared to ERA5. ERA5-Land has been produced by replaying the land component of the ECMWF ERA5 climate reanalysis. Reanalysis combines model data with observations from across the world into a globally complete and consistent dataset using the laws of physics. Reanalysis produces data that goes several decades back in time, providing an accurate description of the climate of the past. Air temperature (2 m): Temperature of air at 2m above the surface of land, sea or in-land waters. 2m temperature is calculated by interpolating between the lowest model level and the Earth's surface, taking account of the atmospheric conditions. The original ERA5-Land dataset (period: 2000 - 2020) has been reprocessed to: - aggregate ERA5-Land hourly data to daily data (minimum, mean, maximum) - while increasing the spatial resolution from the native ERA5-Land resolution of 0.1 degree (~ 9 km) to 30 arc seconds (~ 1 km) by image fusion with CHELSA data (V1.2) (https://chelsa-climate.org/). For each day we used the corresponding monthly long-term average of CHELSA. The aim was to use the fine spatial detail of CHELSA and at the same time preserve the general regional pattern and fine temporal detail of ERA5-Land. The steps included aggregation and enhancement, specifically: 1. spatially aggregate CHELSA to the resolution of ERA5-Land 2. calculate difference of ERA5-Land - aggregated CHELSA 3. interpolate differences with a Gaussian filter to 30 arc seconds 4. add the interpolated differences to CHELSA Data available is the daily average, minimum and maximum of air temperature (2 m). Spatial resolution: 30 arc seconds (approx. 1000 m) Temporal resolution: Daily Pixel values: °C * 10 (scaled to Integer; example: value 238 = 23.8 %) Software used: GDAL 3.2.2 and GRASS GIS 8.0.0 (r.resamp.stats -w; r.relief) Original ERA5-Land dataset license: https://cds.climate.copernicus.eu/api/v2/terms/static/licence-to-use-copernicus-products.pdf CHELSA climatologies (V1.2): Data used: Karger D.N., Conrad, O., Böhner, J., Kawohl, T., Kreft, H., Soria-Auza, R.W., Zimmermann, N.E, Linder, H.P., Kessler, M. (2018): Data from: Climatologies at high resolution for the earth's land surface areas. Dryad digital repository. http://dx.doi.org/doi:10.5061/dryad.kd1d4 Original peer-reviewed publication: Karger, D.N., Conrad, O., Böhner, J., Kawohl, T., Kreft, H., Soria-Auza, R.W., Zimmermann, N.E., Linder, P., Kessler, M. (2017): Climatologies at high resolution for the Earth land surface areas. Scientific Data. 4 170122. https://doi.org/10.1038/sdata.2017.122
-
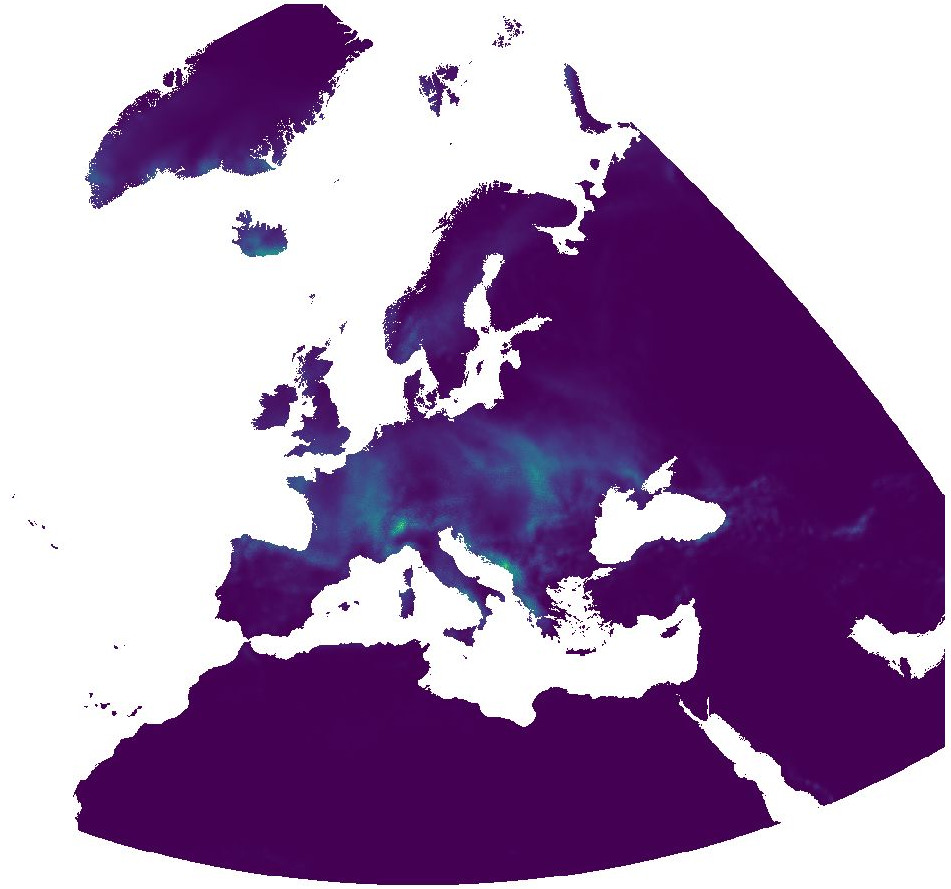
Overview: ERA5-Land is a reanalysis dataset providing a consistent view of the evolution of land variables over several decades at an enhanced resolution compared to ERA5. ERA5-Land has been produced by replaying the land component of the ECMWF ERA5 climate reanalysis. Reanalysis combines model data with observations from across the world into a globally complete and consistent dataset using the laws of physics. Reanalysis produces data that goes several decades back in time, providing an accurate description of the climate of the past. Total precipitation: Accumulated liquid and frozen water, including rain and snow, that falls to the Earth's surface. It is the sum of large-scale precipitation (that precipitation which is generated by large-scale weather patterns, such as troughs and cold fronts) and convective precipitation (generated by convection which occurs when air at lower levels in the atmosphere is warmer and less dense than the air above, so it rises). Precipitation variables do not include fog, dew or the precipitation that evaporates in the atmosphere before it lands at the surface of the Earth. This variable is accumulated from the beginning of the forecast time to the end of the forecast step. The units of precipitation are depth in metres. It is the depth the water would have if it were spread evenly over the grid box. Care should be taken when comparing model variables with observations, because observations are often local to a particular point in space and time, rather than representing averages over a model grid box and model time step. The spatially enhanced daily ERA5-Land data has been aggregated on a weekly basis starting from Saturday for the time period 2016 - 2020. Data available is the weekly average of daily sums and the weekly sum of daily sums of total precipitation. File naming: Average of daily sum: era5_land_prectot_avg_weekly_YYYY_MM_DD.tif Sum of daily sum: era5_land_prectot_sum_weekly_YYYY_MM_DD.tif The date in the file name determines the start day of the week (Saturday). Values are mm * 10. Example: Value 218 = 21.8 mm